July 22, 2026

Natural ageing and accelerated artificial ageing are two main methods for testing the durability of materials exposed to different weathering conditions. We investigated the colour change of untreated larch and spruce wood aged in a natural environment over a period of 18 months, and spruce and larch wood protected with a transparent coating and a coloured coating for outdoor use using the accelerated artificial ageing method. Unprotected wood shall have a different colour after two months of exposure. In the case of spruce, the colour points move into the grey zone of the a*b* plane, while in the case of larch the yellow and red colours are still detectable. In the case of coated wood, the gloss and colour change depend on the type of coating and the wood. As the material ages, this affects the colour difference ∆E*, the shift of the points in the a*b* colour plane and the gloss.
Discolouration of wood can affect the natural appearance of many wood species and cause significant economic problems (damage) in the timber industry. The discolouration of wood is caused by environmental factors, both biotic (fungi, moulds) and abiotic (the effect of changes in the environment such as solar radiation, rain, snow, wind, air pollution, temperature, humidity, etc.). Biotic factors are greatly mitigated by design solutions, by keeping the moisture content of the wood below the growth limit of micro-organisms. However, abiotic factors cannot be avoided. To slow down ageing, we protect the wood with coatings.
Larch and spruce wood are often used outdoors. Due to their exposure to the elements, they are subject to long-term ageing and associated discolouration. Solar radiation, the UV component of which causes photochemical changes in wood, has a strong influence on the change in wood properties. The main cause of these changes is mainly the interaction of polysaccharides and lignin with the near-UV-A light component in combination with other abiotic factors. The degradation of wood components is reflected in the change of their mechanical and physicochemical properties (change of initial colour, loss of gloss, roughness and cracks, loss of mass) (Geffertova, Jarmila & Geffert, Anton & Vybohova, Eva. (2018)). For the observer, the most noticeable change is the change of colour (Figure 1).
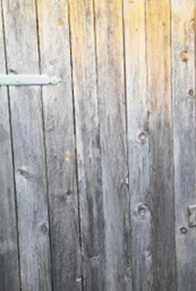
Figure 1: Colour change of spruce wood due to UV and other weathering on the west side of the building after 5 years.
The colour of the wood depends on the species as well as the angle of view or the angle of illumination. The colour of wood is determined by its chemical polymer composition of cellulose, hemicellulose and lignin. Lignin is mainly responsible for the characteristic colour of wood. The amount and distribution of the chemical components varies with the annual increment (annual growth) and is different for each species of wood. In addition to the orientation of the fibres due to the growth of the tree (straight, wavy, spiral and irregular), this influences the texture of the wood surface, which can be accentuated by different cuts (radial, tangential, transverse). When cutting, the wood fibres are cut at a certain angle, thus changing the appearance of wood at different viewing angles. (Figure 2, Figure 3) Wood materials change colour (similar to the phenomenon of iridescence) as the viewing angle or the angle of illumination changes (Figure 2).

Figure 2: Visual appearance of the wood surface in relation to the orientation of the wood fibres (arrow direction).
Colour differences ∆E* < 2 are normal and acceptable in wood and are even desirable in certain wood species and for certain applications (Figure 3). When considering colour homogeneous surfaces, this dimension is considered as a barely perceptible colour difference.
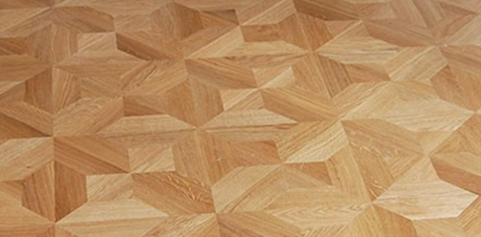
Figure 3: Wood texture plays an important role in the visual perception of the surface.
Measuring the surface colour of a material or product is important for a very wide range of industrial applications, including untreated, painted and varnished surfaces in the manufacture of wood products. Instrumental measurements are often used to assess and compare colour, allowing numerical quantification of colour to avoid the highly subjective visual perception inherent to humans.
For complex colour measurements, we often use a colour spectrum that can be measured with a spectrophotometer, using calibrated standard samples as a reference. Since it is impossible to determine the absolute colour values of a sample, we always work with approximations. The human eye can detect colour differences as small as 0.5 CIE Lab units (Figure 4) and thus distinguish millions of colours.

Figure 4: CIELAB Colour Space
The CIELAB system, also L*a*b*, designed by the International Commission on Illumination, represents a space with three axes L*, a* and b*. The L* value represents the brightness of a colour from black (L=0) to white (L=100). The a* and b* values express the values of the four unique colours of human vision: red (+a*), green (-a*), yellow (+b) and blue (-b*). Since CIELAB is measured in three dimensions, there are an infinite number of colour possibilities. This allows the standard to better approximate human vision. Chromaticity is visualised and quantified using the a*b* plane of the CIELAB colour space (Figure 4).
The gloss of wood is the visual impression we get when we look at the surface. If most of the incident light is reflected correctly and only a small part is scattered, we see a surface with a higher gloss. The texture of wood plays an important role in this. Gloss is the volume of light directly reflected from the surface of the wood (Figure 5). The amount of specular and diffuse reflection varies depending on the surface of the object. On rough surfaces with low gloss, the specular component is weak and the diffuse light is stronger.
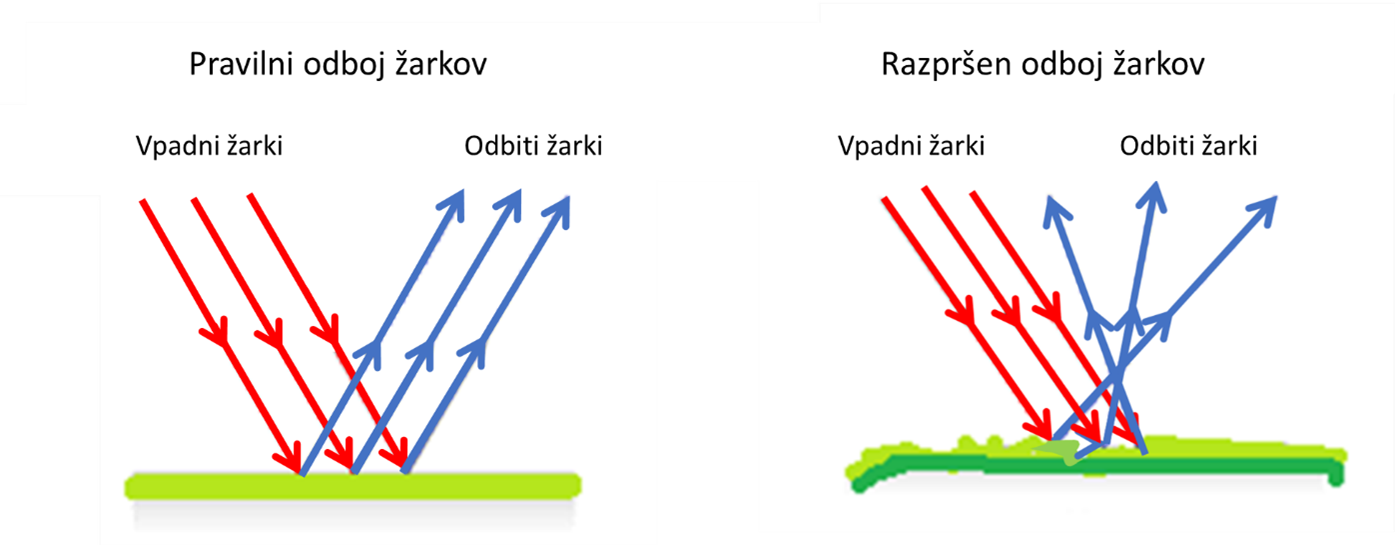
Figure 5: The reflection of light on a flat surface is called specular or regular reflection because the angle of refraction of the light is equal to the angle of reflection. On rough surfaces, diffuse reflection occurs because the surface behaves like an infinity of small irregular surfaces reflecting rays in several directions.
Wood ageing testing
Materials and methods
Unprotected spruce and larch wood was exposed to natural ageing, while wood protected with exterior coatings was exposed to accelerated artificial ageing and the colour change on the surface was monitored. The samples were equilibrated at 20 °C and 65 % relative humidity before and after exposure to ageing.
Natural ageing of spruce and larch
Samples of larch and spruce wood measuring 150 mm × 75 mm × 20 mm were exposed to the natural environment for 18 months. The exposure started in January. Every 2 months, one sample was taken, weighed and measured for dimensions and colour (Figure 6).
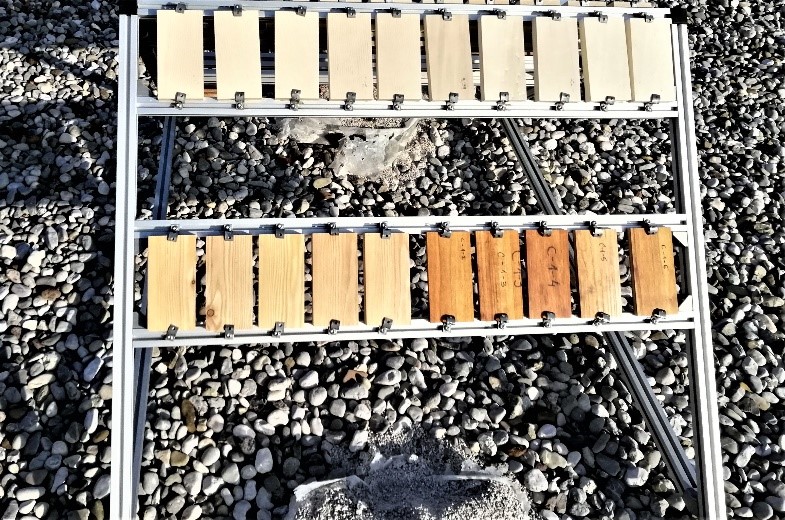
Figure 6: Samples of spruce and larch wood during exposure to natural ageing on the roof of a building in Izola for a period of 18 months.
Accelerated artificial ageing of spruce and larch protected by exterior coatings
Ten samples of larch and ten samples of spruce, 75 mm × 75 mm × 20 mm, were equilibrated at 20 °C and 65 % relative humidity. Five samples of spruce and five samples of larch were coated with a clear exterior coating, and five samples with a coloured exterior coating. The coating was applied at 80 g/m2 in two coats (Figure 7). After curing at room temperature for 24 hours, the samples were re-equilibrated at 20°C and 65 % relative humidity. Before exposing the samples to accelerated ageing in a QUV accelerated weathering tester, the colour and gloss of the samples were measured.
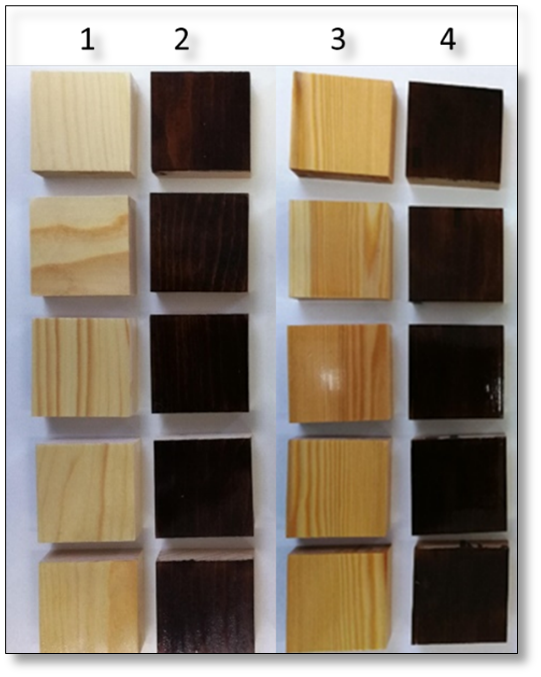
Figure 7: Samples prepared for accelerated ageing tests (Column 1- Spruce transparent lacquer, Column 2- Spruce, coloured rosewood lacquer, Column 3- Larch, transparent lacquer, Column 4- Larch, coloured rosewood lacquer).
Accelerated artificial ageing tests on spruce and larch were carried out according to EN-927-6 – ‘Paints and varnishes – Coating materials and coating systems for exterior wood – Part 6: Exposure of wood coatings to artificial weathering by fluorescent UV lamps and water’.
The accelerated artificial ageing cycle consisted of four stages:
Before and after exposure to accelerated ageing, samples were weighed and colour measured in the CIE L*a*b* colour space using an Erichsen Colour and Gloss Unit SPEKTROMASTER 565-45. The ΔE* value was used to determine the colour differences that occurred after weathering (CIE calculation method76). The ΔE colour difference was calculated by determining the Euclidean distance between the colours:
![]()
∆E is the colour difference of two colours expressed in CIEL*a*b colour space coordinates.
L2*-L1* represents the difference in brightness between the sample and the standard colours.
a2*-a1* represents the difference in red or green colour between the two observed samples.
b2*-b1* indicates differences in blue or yellow between the two samples.
The ∆E* colour difference evaluations define the following differences:
The gloss of samples before and after accelerated ageing was also measured at 60°. The measured values give the following gloss levels:
Results
Figure 8 and Figure 9 show the colour changes of spruce and larch wood samples before exposure and after 2, 4, 6, 8, 10, 12, 14, 16 and 18 months of natural ageing.

Figure 8: Colour of spruce wood by exposure time: 0, 2, 4, 6, 8, 10, 12, 14, 16 and 18 months.
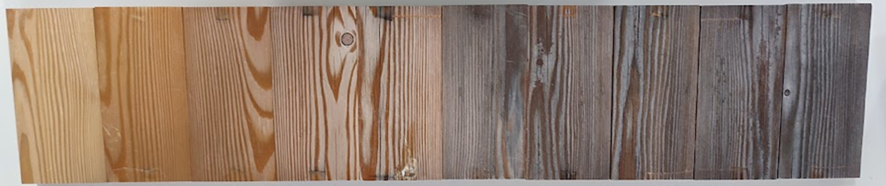
Figure 9: Colour of larch wood by exposure time: 0, 2, 4, 6, 8, 10, 12, 14, 16 and 18 months.
For both wood species, after two months of exposure to the natural environment, a colour difference was already detected both visually and in the measured colour difference ∆E* > 12 (colour difference; Table 1). The surface of the spruce had a slight red colour after two months, after four months the red colour was even more intense, and then by the end of the measurements the red and yellow content had rapidly decreased and the grey content had increased (a* = ± 2). The colour of the larch naturally shows a high proportion of red, which increased slightly after two months of exposure, while the proportion of yellow and red decreased slowly over the next six months and more rapidly over the last ten months, when grey became dominant.
Table 1: Colour difference between spruce and larch after exposure to natural ageing.
| No. Months | Δ E spruce | Δ E larch |
| M2 | 13,19 | 15,09 |
| M4 | 14,15 | 15,72 |
| M6 | 19,79 | 25,43 |
| M8 | 20,98 | 28,25 |
| M10 | 29,95 | 33,76 |
| M12 | 31,88 | 36,04 |
| M14 | 33,26 | 36,22 |
| M16 | 35,81 | 37,85 |
| M18 | 38,12 | 44,17 |
Accelerated artificial ageing of spruce and larch protected by exterior coatings
For wood protected with exterior coatings, in addition to the colour difference ∆E*, chromaticity and gloss are also important data. In all samples observed, the artificial accelerated ageing resulted in a colour change (∆E* > 12). The highest colour change was observed in larch coated with rosewood colour varnish and the lowest in larch coated with transparent varnish (Figure 10). With the transparent varnish, the surface of the spruce wood contained more yellow colour after the artificial ageing was completed, while the surface of the larch wood contained less yellow and red colour (paler surface). With the coloured varnish, however, more yellow and red colour was detected on the surface after the end of testing (the surface became more orange).
Gloss was also measured on samples subjected to accelerated ageing. In addition to the composition of the coating, the substrate to which the coating is applied also influences the gloss variation of the coating. High gloss was achieved with transparent lacquer on spruce and coloured rosewood lacquer on larch and spruce (Figure 11). However, the values for the transparent varnish on larch were below 70 GU, which is the threshold for high gloss. After exposure to artificial ageing, a semi-gloss was measured in all samples. The smallest difference in gloss was measured on larch coated with transparent varnish. The greatest difference was measured in larch coated with rosewood varnish.
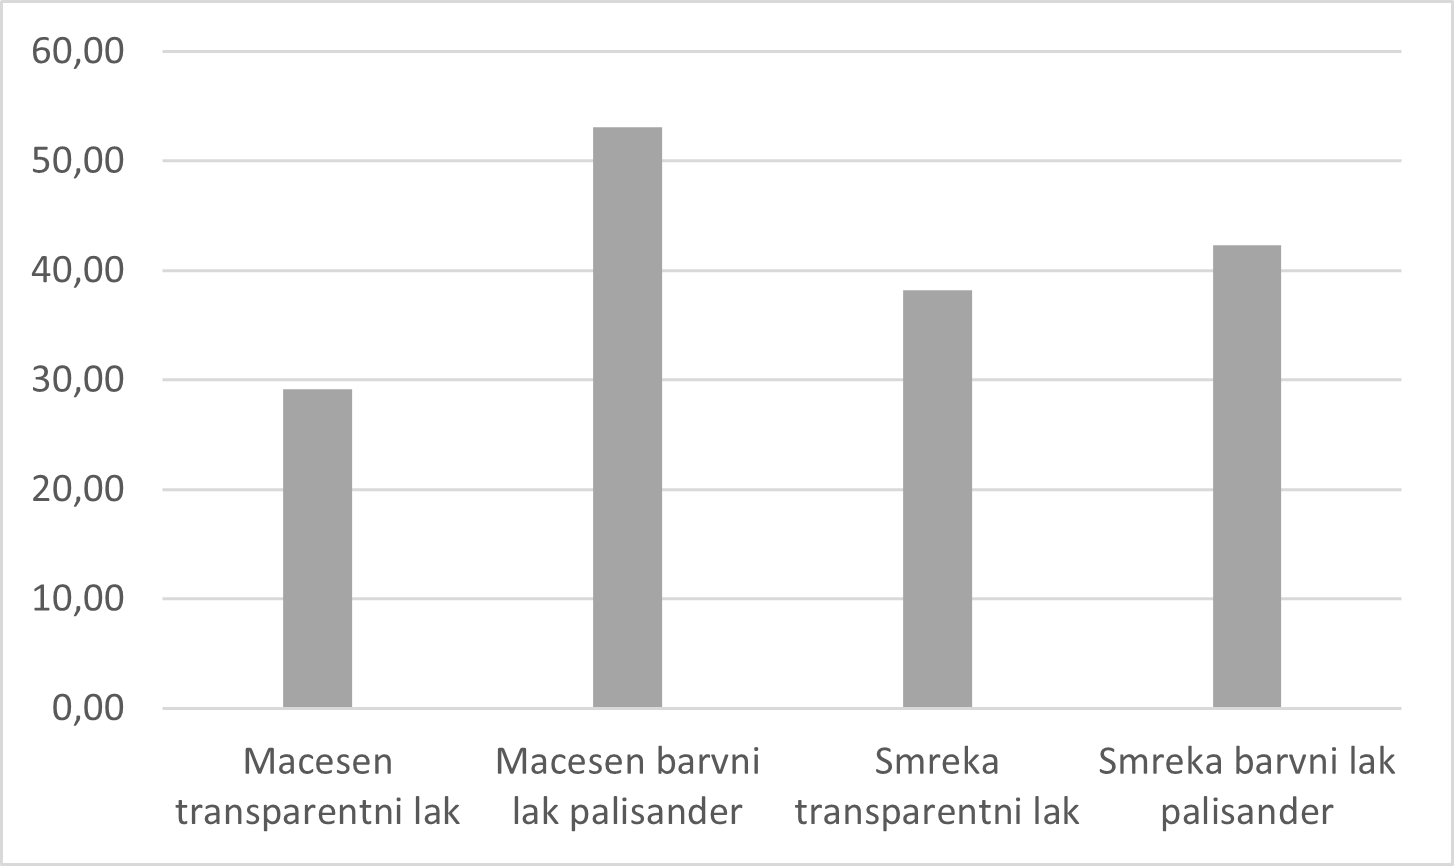
Figure 10: Average difference in colour ΔE* between spruce and larch after exposure to accelerated artificial ageing.

Figure 11: Gloss before and after exposure of spruce and larch samples to accelerated artificial ageing.
Conclusion
Surface appearance is an important parameter for assessing the quality and market value of wood products. The study of material ageing is used to predict changes in materials and improve product durability. Identifying changes in colour and gloss helps users to make decisions on the type of materials to be used for a particular purpose.
Authors: Mag. Marica Mikuljan and Dr. Andreja Kutnar, InnoRenew CoE
References